

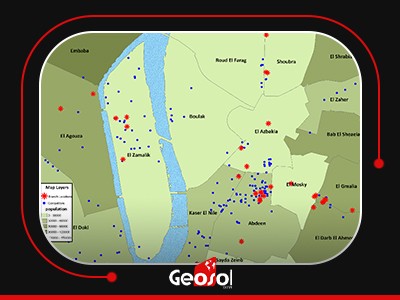
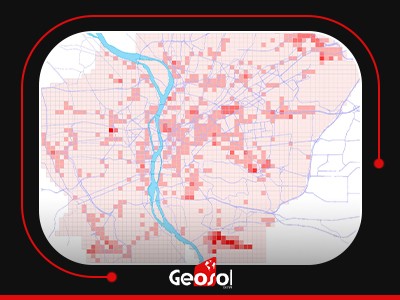
Hot Spot analysis
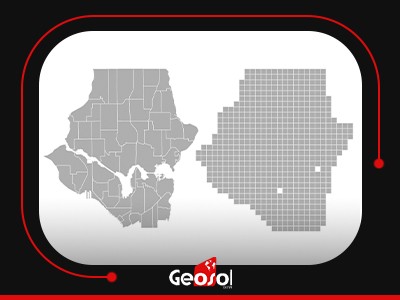
Identifies statistically significant spatial clusters of high values (hot spots) and low values (cold spots), The analysis groups feature when similar high (hot) or low (cold) values are found in a cluster. The polygons usually represent administration boundaries or a custom grid structure.